
Palo Alto · Market note
Zillow's numbers and Palo Alto sales tell different stories. What does that mean for your home?
Zillow's index puts Palo Alto's annual growth at 5.6%, the smallest of five nearby communities. The Palo Alto homes that sold this year reached a record median price per square foot. Both are true, because they measure different things.
- Median price per square foot
- $2,166
- Each of this year's three quarters set a new quarterly high in records going back to 1998
- Sold above the original list price
- 70%
- 205 of the 291 sales that have a recorded original list price. Asking prices are a seller's strategy, so this is not a premium over market value
- Median days on market
- 8 days
- The MLS figure, not elapsed time from listing to contract
Zillow’s home value index puts Palo Alto’s annual growth at 5.6%, the smallest increase among five nearby communities I reviewed. Yet the Palo Alto homes in my 2026 sales analysis reached a record median price per square foot.
If you’re thinking about selling, that raises a useful question: which numbers should guide the price of your home?
Neither is a price tag for your address. Understanding the difference is a starting point for deciding how to price, prepare, and introduce your home to buyers.
One market, two different measures
Zillow’s Home Value Index tracks estimated values across a community’s housing stock, including homes that haven’t sold. Its middle-tier index describes homes in the middle of the value range. It is not the individual Zestimate displayed on your property’s page.
From August 2025 to August 2026, Zillow’s typical single-family home value rose 5.6% in Palo Alto, to approximately $3.78 million. Atherton, Menlo Park, Los Altos, and Los Altos Hills each recorded larger percentage gains.
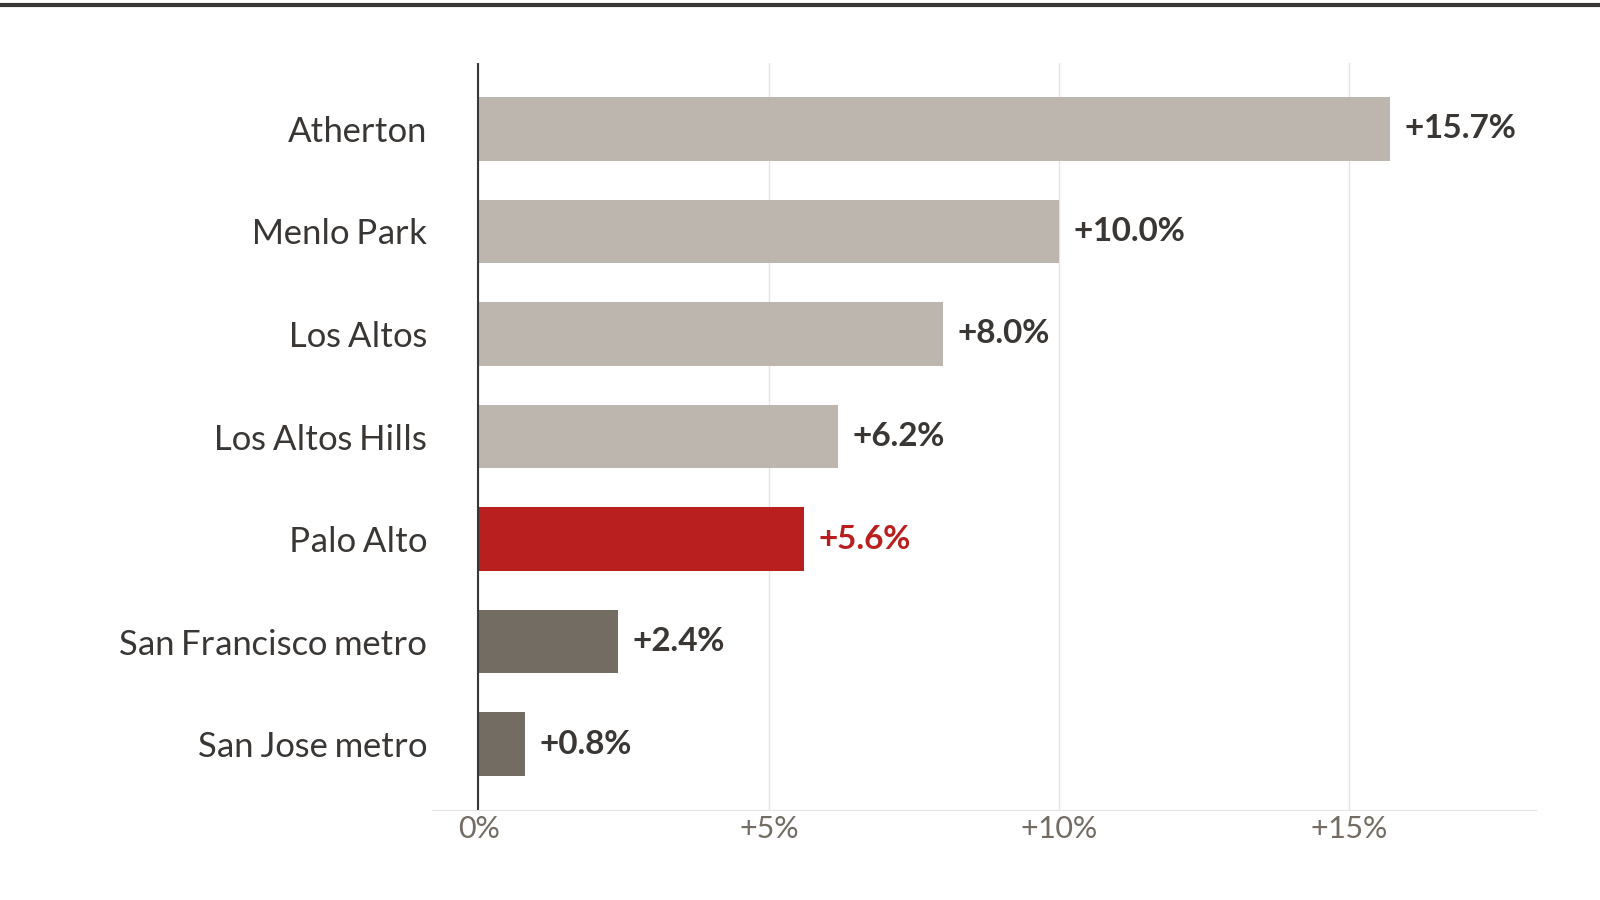
That makes Palo Alto the slowest-growing of these five communities on this particular measure. It does not tell us that your home is worth less than it was, or that buyers have stopped competing here.
What buyers actually paid
My analysis covers 299 Palo Alto single-family homes that went into contract in 2026 and had closed by September 25. It’s a partial year, and it counts closed sales only:
- $2,166 per square foot: the median for homes in the sample. Each of this year’s three quarters set a new quarterly high in records going back to 1998.
- 70% sold above their original asking price — 205 of the 291 sales that have an original list price recorded.
- 8 days: the median days on market, as the MLS records it.
Those are signs of competition within this sales sample. They are not a promise that every home will sell quickly or above asking. Asking prices are also part of a seller’s strategy; selling above asking does not, by itself, establish a premium over market value.
For a homeowner, the important question is which of those sales are genuinely comparable, and what made buyers respond to them.
Wondering which sales are relevant to your home? Send me your address. I’ll help you identify the useful comparisons and discuss what they suggest for your sale.
Why both numbers can be true
Zillow’s index and the sales figures answer different questions. One tracks estimated whole-home values across a broader housing stock. The other describes the price per square foot of the homes that sold. They also cover different time periods.
The sales median can change because the homes being sold change. Smaller houses, newer construction, renovations, lot characteristics, and neighborhood differences can all affect the result. A rise in the median does not mean every Palo Alto home gained the same amount.
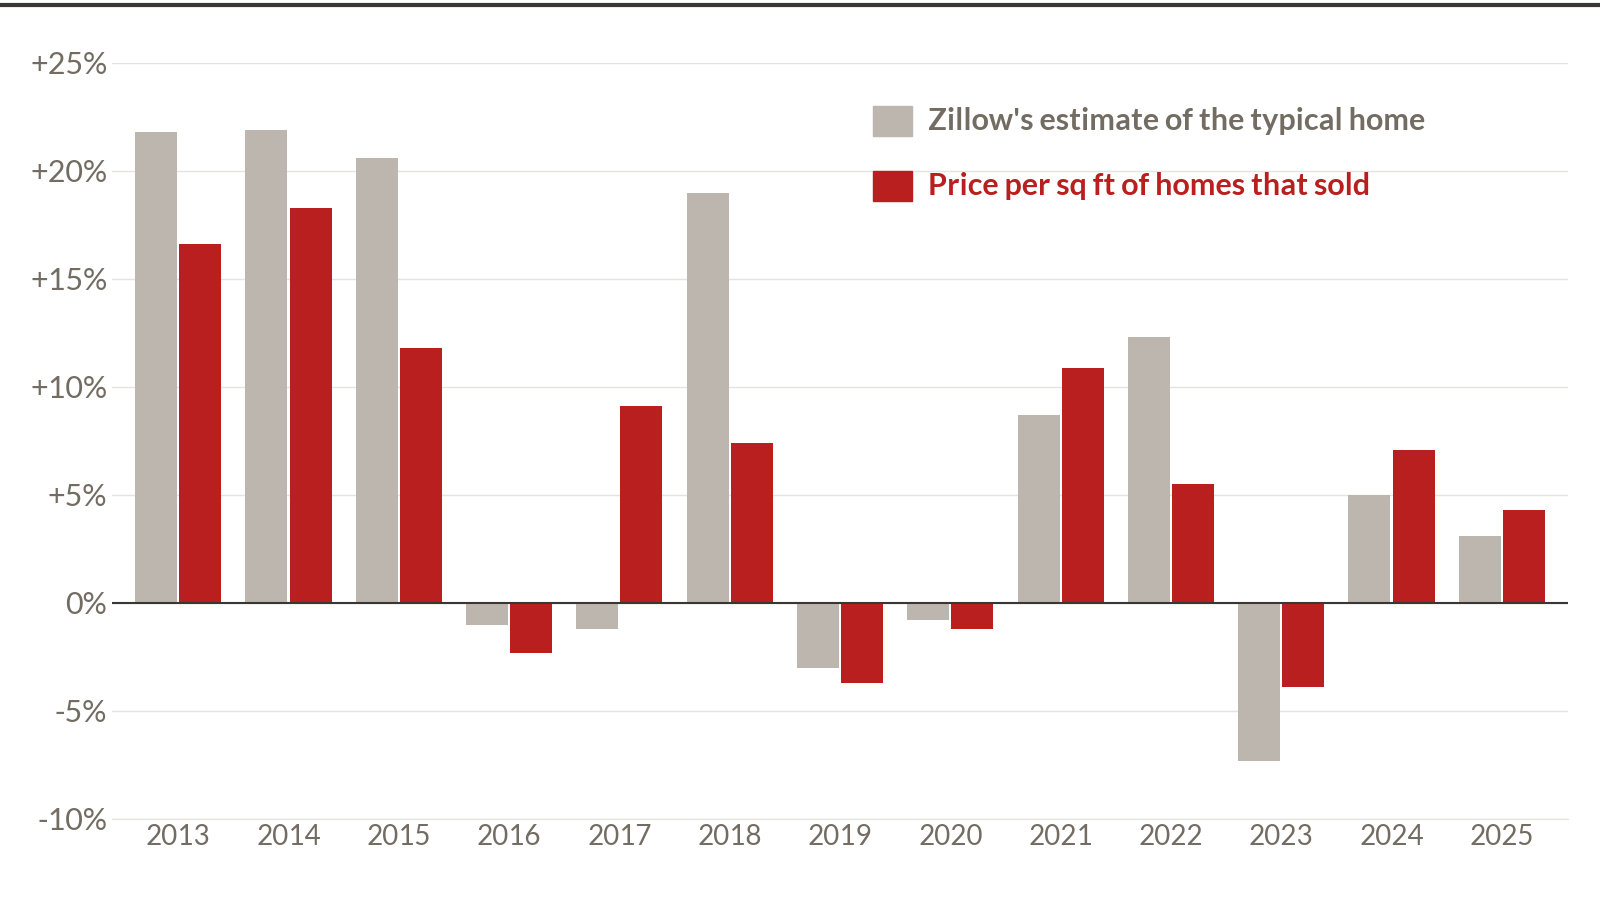
The comparison is useful context. It cannot isolate how much of the difference came from preparation, location, the mix of homes sold, or other factors.
Where local judgment matters
I tour homes across Palo Alto, Menlo Park, and Atherton every week. I’m looking at what buyers will compare: the layout, light, condition, street, outdoor space, and how the home feels in person.
A nearby sale may look like a perfect comparison on a screen and feel quite different when you walk through the door. A renovated home may help show what buyers will pay for convenience, but it doesn’t automatically tell us what a home needing work should list for.
That’s where I begin with a seller: the right comparable sales, an honest assessment of the home, and a plan for what is worth changing.
Sometimes that means targeted improvements. Sometimes it means leaving a perfectly serviceable kitchen alone and focusing on light, paint, landscaping, or presentation. Sometimes selling as-is is the better fit for the owner’s circumstances.
My role is to help make those decisions, and personally guide the preparation we agree on. Through G.Studio, my staging company, I also shape the home’s presentation with customized staging included in my listing service. How that worked on one Palo Alto house.
The goal is to spend thoughtfully and give buyers clear reasons to choose your home.
Before you spend money preparing to sell
Start with three questions:
- What would buyers compare my home with today? Look beyond proximity and square footage to condition, layout, lot, and location.
- Which improvements are worth considering, and which can we skip? A larger renovation budget is not automatically a better selling strategy.
- How should price and presentation work together? The asking price needs to make sense alongside the alternatives buyers can actually purchase.
You don’t need to finish the projects before calling me. The earlier conversation is often the useful one.
Let’s look at your home, not just the headline
If selling is on your mind, call or text me with your address and the timing you’re considering. We can review relevant sales, discuss a realistic price range, and identify what I would, and wouldn’t, do before listing.
Whether you’re planning for this season or a year or two ahead, you can start with a conversation.
Discuss my home's price and preparation
Prefer to text? Text Maggie at 650.709.5588. English and Mandarin.