
Menlo Park Menlo Park Home Prices & Recent Sales
Explore what homes have sold for across Menlo Park and how results vary by area and property type. I’ll help you identify the comparisons that matter and turn them into practical decisions for your sale.
Every single-family sale recorded in Menlo Park over the period stated below — where each one is, what it fetched, and how it did against the price it first asked.
Menlo Park · San Mateo County
What this town actually did.
Closed sales of single-family homes in Menlo Park, Palo Alto, from October 15, 2025 to October 15, 2026. Source: MLSListings. Each sale is listed with the firm that represented the seller. Information deemed reliable but not guaranteed. Figures are medians rather than averages — one very large sale should not move a neighborhood’s number. 1208 sales were recorded in this period; 303 of them carried coordinates and are drawn here. Base map data © OpenStreetMap contributors.
Menlo Park in one paragraph
1208 single-family homes sold in Menlo Park from October 15, 2025 to October 15, 2026, at a median of $3.60M. The typical one is a 2,116 sq ft house from 1955 on a 6,505 sq ft lot, at $1,734 a square foot.
Against the price sellers first asked — not the price they had been reduced to — the median sale finished +2.8%, and 69% of them closed at or above that first asking price. Both figures come from the 288 sales carrying an original asking price, of 303 mapped.
Where in Menlo Park, and what that is worth
Menlo Park’s MLS areas, by median sale price over the same period. The gap between the top and the bottom of this list is 5.0× — inside one town of about ten square miles.
| Area | Sold | Median | $/sq ft | vs first ask | On market |
|---|---|---|---|---|---|
| Central Menlo | 49 | $6.40M | $2,046 | +1.7% of 47 | — |
| Menlo Oaks Area | 12 | $5.06M | $1,964 | +10.4% | — |
| Sharon Heights / Stanford Hills | 20 | $4.81M | $1,647 | −0.5% | — |
| County / Alameda Area | 55 | $4.00M | $1,767 | +0.0% of 46 | — |
| Allied Arts / Downtown | 26 | $3.60M | $1,838 | +1.7% | — |
| Willows / O'Conner Area | 37 | $3.52M | $1,905 | +4.4% | — |
| Middlefield to El Camino Menlo Park | 20 | $2.86M | $1,384 | +8.0% of 19 | — |
| Flood Park Area | 19 | $2.51M | $1,667 | +5.3% | — |
| Alpine Road Area | 4 | $2.36M | $1,521 | +0.0% of 3 | — |
| County Area / Fair Oaks Ave | 33 | $2.20M | $1,438 | +4.7% of 32 | — |
| East of U.S. 101 Menlo Park | 25 | $1.27M | $1,106 | +8.4% of 24 | — |
| Dumbarton Etc. | 1 | too few | — | — | — |
| Felton Gables | 1 | too few | — | — | — |
“Too few” means under 3 sales in the period — counted, but not given a median, because one house is not a market. Where a “vs first ask” figure rests on fewer sales than the row’s total, the count it uses is shown beside it: sales with no original asking price in the export cannot be compared and are left out of that column only. "On market" is a count of what is listed or in escrow right now across all brokerages; no listing is displayed here.
In Menlo Park, the first two weeks are the sale
Every sale grouped by how long it took, against the price it first asked. Not against a reduced price — against the number it launched at.
Homes here that sold in the first week finished +7.4% against their opening price. The ones still on the market after sixty days finished −8.3%. That gap is not explained by price — the slow sellers are not the cheap ones. Whatever is going to happen, happens early.
Every sale: what it fetched, and how it did
One dot per home. Across is the result against the price it first asked. Up is what it actually sold for. Red beat its asking price; charcoal did not.
The dashed lines are the two medians — $3.60M and +2.8%. A dot to the right of the upright line beat the price it opened at; a dot above the flat one sold for more than the typical home here.
What the corners tell you is whether the top of Menlo Park behaves like the rest of it.
What recent sales suggest about price bands
These figures compare each home’s sale price with the price it first asked. They show how homes in different price bands performed during this period; they do not predict what any particular home will sell for.
The results reflect many factors at once, including preparation, presentation, pricing, competition, timing, and negotiation. Treat the table as context for a pricing conversation, not as a formula.
How results varied by price range
Buyers consider different alternatives at different price points. This breakdown helps us focus on the part of the market most relevant to your home.
In this sample the Over $7M band came out weakest against first asking (−1.0% from 30 sales ) and Under $3M strongest (+5.8% from 126 sales ). Most of the activity sat in Under $3M, with 126 sales. This is what these homes did, not a rule about what yours will do.
| First asked | Sales | Against first ask | Reached it |
|---|---|---|---|
| Under $3M | 126 | +5.8% | 78% |
| $3M – $4.5M | 70 | +0.9% | 67% |
| $4.5M – $7M | 62 | +0.7% | 65% |
| Over $7M | 30 | −1.0% | 47% |
Pricing strategy becomes especially important in the higher price bands, where the sample is smaller and buyer demand can be more selective. A property-specific analysis is essential.
How recent sales compared with original asking prices
This comparison shows the median sale price as a percentage of the original asking price for each neighborhood during the stated period. It describes how the homes in the sample performed; it does not measure neighborhood quality or predict the result for one property. Small samples can produce large-looking percentages, so read the sale count beside each figure. City-wide: +2.8%.
Recent median sale prices by neighborhood
Median prices and price-per-square-foot figures help show the range of homes that sold in each area. They are not a valuation for one property. Differences in lot size, architecture, condition, location, and sale mix can materially affect the comparison.
Price per square foot is a comparison tool, not a substitute for a property-specific valuation.
What the recent sample shows by home configuration
Stories, square footage, lot size, age, and neighborhood are connected variables. This comparison describes the homes in the sample; it does not isolate the effect of being one or two stories.
Single story168 sales
- Median price
- $3.25M
- House
- 1,659 sq ft
- Lot
- 6,392 sq ft
- Typically built
- 1951
- Against first ask
- +5.0%
Two story97 sales
- Median price
- $4.85M
- House
- 2,730 sq ft
- Lot
- 7,410 sq ft
- Typically built
- 2000
- Against first ask
- +0.1%
In this sample, two story homes were larger and had higher median sale prices. Measured against first asking prices, single story homes came out ahead of the other group. That may reflect price band, location, condition, and the mix of homes — not stories alone.
If this is your street
The map says what sold. It doesn’t say what yours would.
Menlo Park is not one market and pricing it as though it were is the most common and most expensive mistake made here. Maggie will tell you which of the things you could do to the house is worth doing, and which is not.
Recent work
Selected Peninsula transactions
I use market research to guide real decisions: where to invest in preparation, how to present a home’s strengths, and how to position it among the choices buyers have.
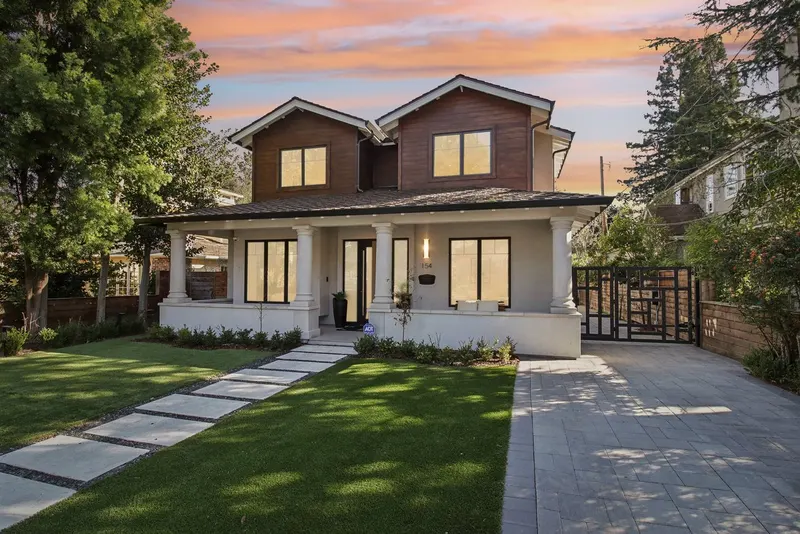
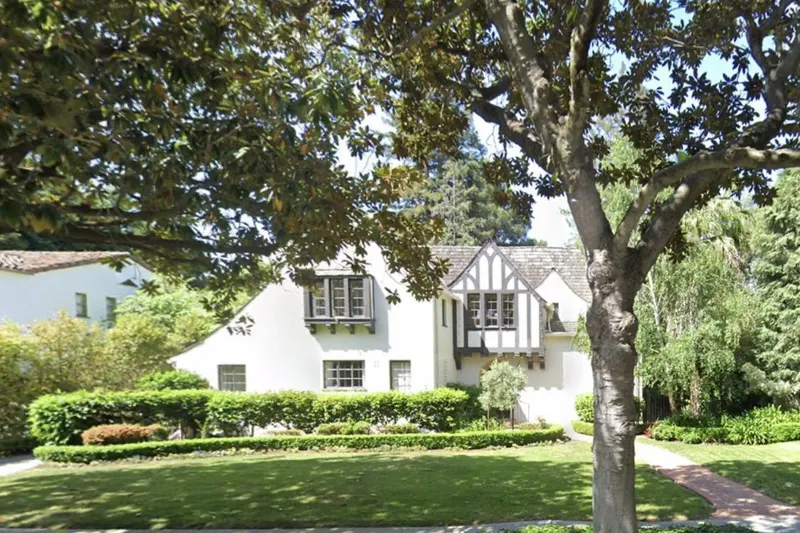
These sales are elsewhere on the Peninsula rather than in Menlo Park. The work is the same; the addresses are not, and saying so is better than implying otherwise.
Local market insight from Maggie Ma · HOUSE EXPERT
Let’s make a plan for your Menlo Park home.
Your home’s competition may be a handful of relevant properties rather than every listing in Menlo Park. I’ll help you look at the homes that overlap with yours in location, price, size, and condition.
The most useful next step is a closer look at your property. I’ll help you compare relevant sales and current competition, identify worthwhile improvements, and decide how to bring your home to market.
I personally shape the design, preparation, and staging, coordinate the work, and guide pricing, marketing, and negotiation. You’ll have a clear plan and someone keeping the details moving—without taking on a second job as a project manager.
Plan my sale with Maggie Text Maggie
Whether you’re ready soon or simply thinking ahead, we can start with your questions and timeline.
From my tours
Houses I’ve walked through in Menlo Park
I tour new listings here every week. These are my notes — what I noticed inside, and when a house sells, what happened.