
Los Altos Hills Los Altos Hills Home Prices & Recent Sales
Recent Los Altos Hills sales provide a starting point for understanding your property’s market. Together, we’ll look beyond acreage and square footage to the land, setting, design, and condition that make your home distinctive.
Every single-family sale recorded in Los Altos Hills over the period stated below — where each one is, what it fetched, and how it did against the price it first asked.
Los Altos Hills · Santa Clara County
What this town actually did.
Closed sales of single-family homes in Los Altos Hills, Palo Alto, from October 16, 2025 to October 15, 2026. Source: MLSListings. Each sale is listed with the firm that represented the seller. Information deemed reliable but not guaranteed. Figures are medians rather than averages — one very large sale should not move a neighborhood’s number. 1211 sales were recorded in this period; 105 of them carried coordinates and are drawn here. Base map data © OpenStreetMap contributors.
Los Altos Hills in one paragraph
1211 single-family homes sold in Los Altos Hills from October 16, 2025 to October 15, 2026, at a median of $5.47M. The typical one is a 3,742 sq ft house from 1975 on a 1.11-acre lot, at $1,528 a square foot.
Against the price sellers first asked — not the price they had been reduced to — the median sale finished −2.1%, and 43% of them closed at or above that first asking price. Both figures come from the 101 sales carrying an original asking price, of 105 mapped.
In Los Altos Hills, the first two weeks are the sale
Every sale grouped by how long it took, against the price it first asked. Not against a reduced price — against the number it launched at.
Homes here that sold in the first week finished +1.3% against their opening price. The ones still on the market after sixty days finished −10.3%. That gap is not explained by price — the slow sellers are not the cheap ones. Whatever is going to happen, happens early.
Every sale: what it fetched, and how it did
One dot per home. Across is the result against the price it first asked. Up is what it actually sold for. Red beat its asking price; charcoal did not.
The dashed lines are the two medians — $5.47M and −2.1%. A dot to the right of the upright line beat the price it opened at; a dot above the flat one sold for more than the typical home here.
What the corners tell you is whether the top of Los Altos Hills behaves like the rest of it.
What recent sales suggest about price bands
These figures compare each home’s sale price with the price it first asked. They show how homes in different price bands performed during this period; they do not predict what any particular home will sell for.
The results reflect many factors at once, including preparation, presentation, pricing, competition, timing, and negotiation. Treat the table as context for a pricing conversation, not as a formula.
How results varied by price range
Buyers consider different alternatives at different price points. This breakdown helps us focus on the part of the market most relevant to your home.
In this sample the Over $7M band came out weakest against first asking (−6.2% from 29 sales ) and Under $3M strongest (+5.2% from 1 sale , a small sample). Most of the activity sat in $4.5M – $7M, with 50 sales. This is what these homes did, not a rule about what yours will do.
| First asked | Sales | Against first ask | Reached it |
|---|---|---|---|
| Under $3M | 1 · Small sample | +5.2% | 100% |
| $3M – $4.5M | 21 | +2.4% | 67% |
| $4.5M – $7M | 50 | −2.2% | 40% |
| Over $7M | 29 | −6.2% | 28% |
Pricing strategy becomes especially important in the higher price bands, where the sample is smaller and buyer demand can be more selective. A property-specific analysis is essential.
How recent sales compared with original asking prices
This comparison shows the median sale price as a percentage of the original asking price for each neighborhood during the stated period. It describes how the homes in the sample performed; it does not measure neighborhood quality or predict the result for one property. Small samples can produce large-looking percentages, so read the sale count beside each figure. City-wide: −2.1%.
Recent median sale prices by neighborhood
Median prices and price-per-square-foot figures help show the range of homes that sold in each area. They are not a valuation for one property. Differences in lot size, architecture, condition, location, and sale mix can materially affect the comparison.
Price per square foot is a comparison tool, not a substitute for a property-specific valuation.
What the recent sample shows by home configuration
Stories, square footage, lot size, age, and neighborhood are connected variables. This comparison describes the homes in the sample; it does not isolate the effect of being one or two stories.
Single story49 sales
- Median price
- $5.30M
- House
- 3,091 sq ft
- Lot
- 48,352 sq ft
- Typically built
- 1967
- Against first ask
- −1.6%
Two story49 sales
- Median price
- $6.54M
- House
- 4,276 sq ft
- Lot
- 48,352 sq ft
- Typically built
- 1984
- Against first ask
- −3.5%
In this sample, two story homes were larger and had higher median sale prices. Measured against first asking prices, single story homes came out ahead of the other group. That may reflect price band, location, condition, and the mix of homes — not stories alone.
If this is your street
The map says what sold. It doesn’t say what yours would.
Where lots are measured in acres and no two are alike, comparables do less of the work than people expect. Maggie will tell you which of the things you could do to the house is worth doing, and which is not.
Recent work
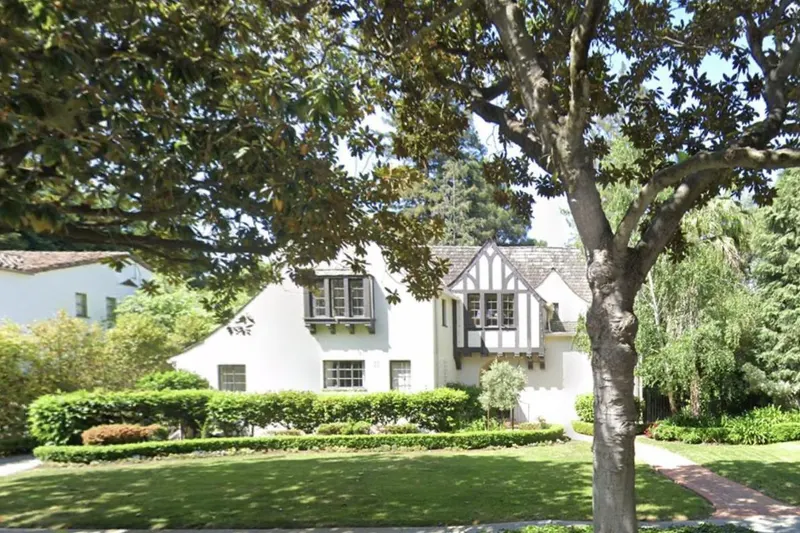
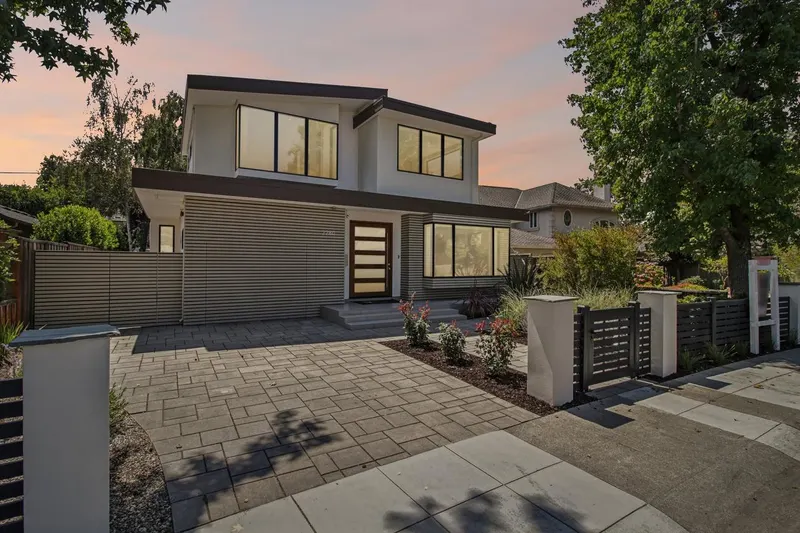
Selected Peninsula transactions
I use market research to guide real decisions: where to invest in preparation, how to present a home’s strengths, and how to position it among the choices buyers have.
These sales are elsewhere on the Peninsula rather than in Los Altos Hills. The work is the same; the addresses are not, and saying so is better than implying otherwise.
Local market insight from Maggie Ma · HOUSE EXPERT
Let’s make a plan for your Los Altos Hills home.
A useful comparison goes beyond square footage and lot size. I’ll help you consider how your home’s setting, usable land, access, condition, and distinctive features compare with the alternatives buyers have.
The most useful next step is a closer look at your property. I’ll help you compare relevant sales and current competition, identify worthwhile improvements, and decide how to bring your home to market.
I personally shape the design, preparation, and staging, coordinate the work, and guide pricing, marketing, and negotiation. You’ll have a clear plan and someone keeping the details moving—without taking on a second job as a project manager.
Plan my sale with Maggie Text Maggie
Whether you’re ready soon or simply thinking ahead, we can start with your questions and timeline.
From my tours
Houses I’ve walked through in Los Altos Hills
I tour new listings here every week. These are my notes — what I noticed inside, and when a house sells, what happened.