
Palo Alto · Green Gables What has sold in Green Gables.
Every single-family sale recorded in Green Gables over the period stated below — where each one is, what it fetched, and how it did against the price it first asked.
Green Gables · Palo Alto
What this neighborhood actually did.
Closed sales of single-family homes in Green Gables, Palo Alto, from October 15, 2025 to October 15, 2026. Source: MLSListings. Each sale is listed with the firm that represented the seller. Information deemed reliable but not guaranteed. Figures are medians rather than averages — one very large sale should not move a neighborhood’s number. 1206 sales were recorded in this period; 40 of them carried coordinates and are drawn here. Base map data © OpenStreetMap contributors.
What this place is
One of the first two Eichler neighbourhoods in the country on the National Register — and the tract where Eichler first hired real architects.
In 1950 Joseph Eichler did something he had not done before: he hired architects.
Robert Anshen and Steve Allen designed the AA-1 model, and Green Gables is where it was built in Palo Alto — sixty-three houses, post-and-beam on a concrete slab with radiant floor heating, glass walls to the rear patio, under $10,000 each.
*Architectural Forum* named the early Eichler tracts Subdivision of the Year in December 1950.
Fifty-five years later, in July 2005, Green Gables and Greenmeadow became the first Eichler neighbourhoods anywhere to be listed on the National Register — the result of a four-year volunteer effort by residents, not a city initiative.
One detail most descriptions get wrong: Eichler did not invent the name. The nomination records that he named the subdivision after the larger neighborhood that was already called that.
The specifics
- Listed on the National Register on July 28, 2005 — with Greenmeadow, the first Eichler neighbourhoods ever listed. Sixty-three homes, forty-five of them contributing.National Register nomination
- The district covers 1914–1996 Channing Avenue, 501–693 Greer Road (odd), 1916–1975 Ivy Lane, and 611–651 odd and 610–786 even Wildwood Lane.National Register nomination
- 1950 was Eichler’s first collaboration with professional architects — Robert Anshen and Steve Allen. The houses are variants of their AA-1 model, originally one story, three bedrooms, one bathroom, about 1,100 square feet.
- Eichler did not coin the name. The nomination states he named the subdivision after the larger neighborhood that already carried it.National Register nomination
- Architectural Forum named the early Eichler tracts Subdivision of the Year in December 1950.Eichler Network
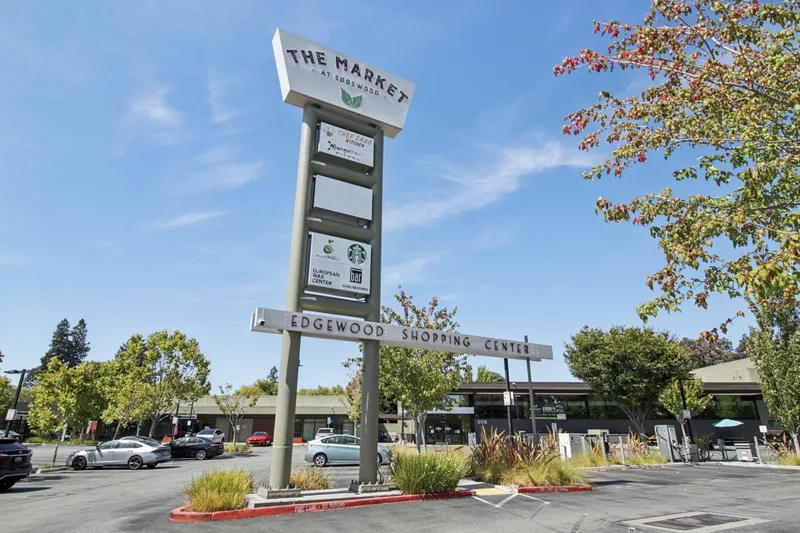
- The adjacent Edgewood tract (1956, 93 lots) is by A. Quincy Jones.City of Palo Alto — Eichler Neighborhood Design Guidelines
Green Gables in one paragraph
40 homes sold in Green Gables over the last year, at a median of $4.45M — above the Palo Alto median of $4.05M.
The typical one is a 2,029 sq ft single-story house from 1950 on a 7,326 sq ft lot, at $2,203 a square foot.
Against the price sellers first asked — not the price they had been reduced to — the median sale here finished +3.4%, and 74% of sellers got at least their asking price.
That is weaker than Palo Alto as a whole, where the median is +5.6%. Here the first number has to be closer to right, because the market is less inclined to correct it upward.
Not planning to sell? That’s fine.
Curious how your home fits today’s market?
Sometimes homeowners simply want a current perspective on the house they’ve lived in for years — how it fits today’s market, what I would or wouldn’t change, or what recent nearby sales may mean for it.
I’m happy to stop by and give you my perspective. No need to prepare the house, and no selling timeline required.
Ask Maggie to take a look →
Thank you. I’ll reach out personally to talk about what would be helpful.
— Maggie
In Green Gables, the first two weeks are the sale
Every sale grouped by how long it took, against the price it first asked. Not against a reduced price — against the number it launched at.
Homes here that sold in the first week finished +10.9% against their opening price. The ones still on the market after sixty days finished −13.9%. That gap is not explained by price — the slow sellers are not the cheap ones. Whatever is going to happen, happens early.
Every sale: what it fetched, and how it did
One dot per home. Across is the result against the price it first asked. Up is what it actually sold for. Red beat its asking price; charcoal did not.
The dashed lines are the two medians — $4.45M and +3.4%. A dot to the right of the upright line beat the price it opened at; a dot above the flat one sold for more than the typical home here.
What the corners tell you is whether the top of Green Gables behaves like the rest of it.
From my tours
Houses I’ve walked through in Green Gables
I tour new listings here every week. These are my notes — what I noticed inside, and when a house sells, what happened.
If this is your street
The map says what sold. It doesn’t say what yours would.
Two houses on the same Green Gables block can be hundreds of dollars a square foot apart, and the difference is almost never the house — it is what was done to it before anyone saw it.
Maggie will tell you which of those things is worth doing on yours, and which is not.