Above Asking · Week of October 5, 2026 · print edition Letter, 3 pieces · use your browser’s Save as PDF

Back to the issue HOUSE EXPERT

Above Asking

Market intel · weekly

Palo Alto · Market note

Zillow's numbers and Palo Alto sales tell different stories. What does that mean for your home?

Zillow's index puts Palo Alto's annual growth at 5.6%, the smallest of five nearby communities. The Palo Alto homes that sold this year reached a record median price per square foot. Both are true, because they measure different things.

Median price per square foot
$2,166
Each of this year's three quarters set a new quarterly high in records going back to 1998
Sold above the original list price
70%
205 of the 291 sales that have a recorded original list price. Asking prices are a seller's strategy, so this is not a premium over market value
Median days on market
8 days
The MLS figure, not elapsed time from listing to contract

Zillow’s home value index puts Palo Alto’s annual growth at 5.6%, the smallest increase among five nearby communities I reviewed. Yet the Palo Alto homes in my 2026 sales analysis reached a record median price per square foot.

If you’re thinking about selling, that raises a useful question: which numbers should guide the price of your home?

Neither is a price tag for your address. Understanding the difference is a starting point for deciding how to price, prepare, and introduce your home to buyers.

One market, two different measures

Zillow’s Home Value Index tracks estimated values across a community’s housing stock, including homes that haven’t sold. Its middle-tier index describes homes in the middle of the value range. It is not the individual Zestimate displayed on your property’s page.

From August 2025 to August 2026, Zillow’s typical single-family home value rose 5.6% in Palo Alto, to approximately $3.78 million. Atherton, Menlo Park, Los Altos, and Los Altos Hills each recorded larger percentage gains.
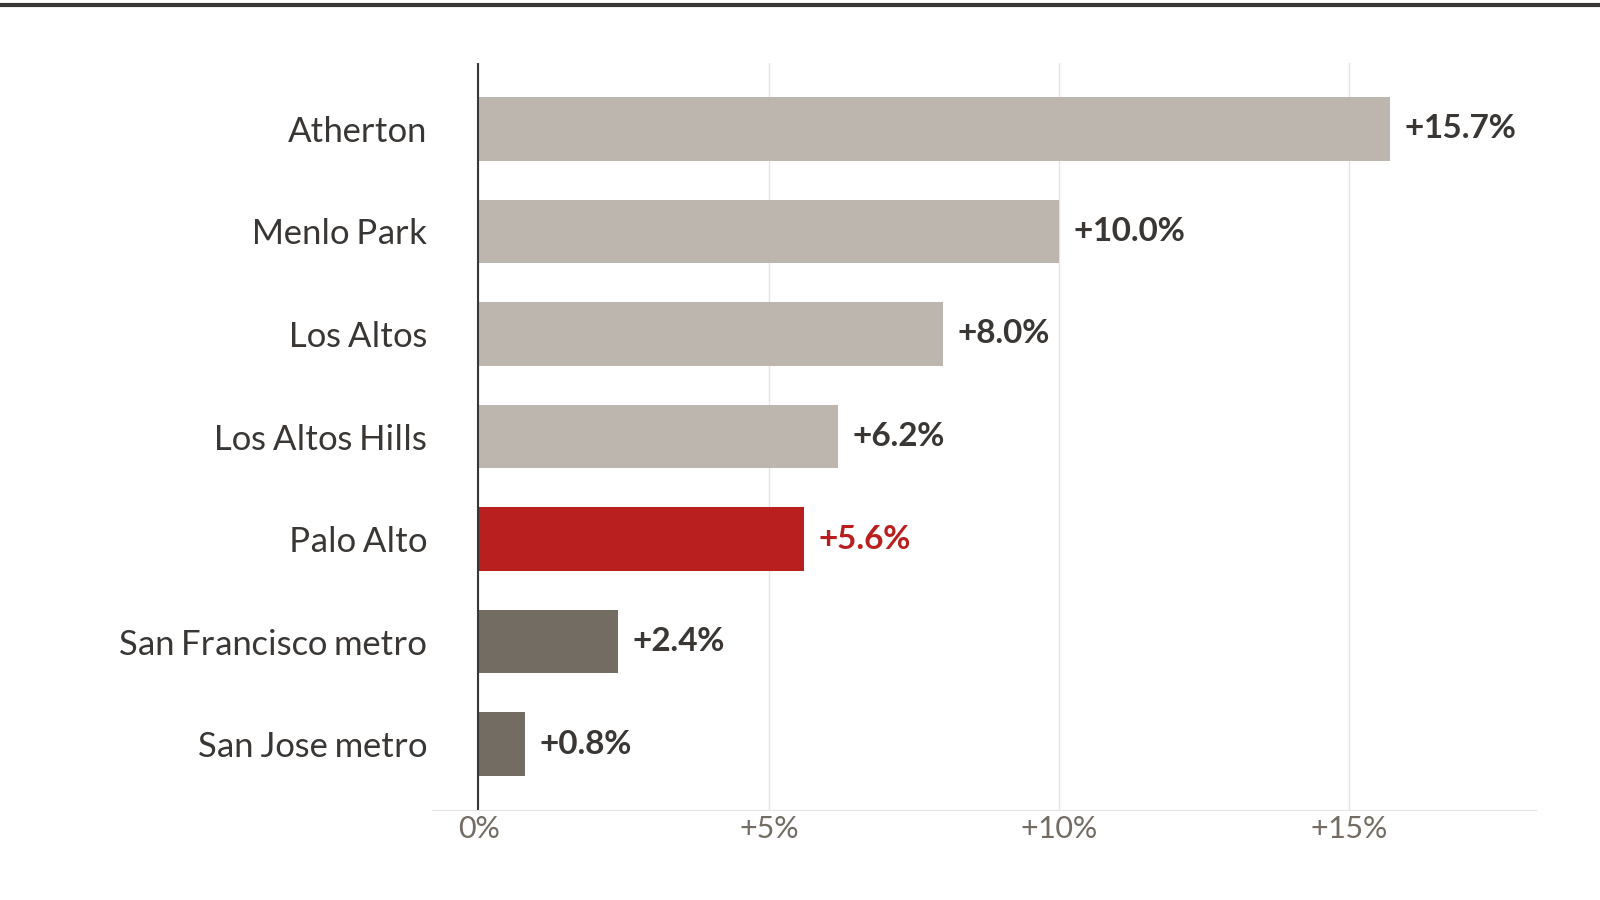
Change in Zillow's typical single-family home value, August 2025 to August 2026: Atherton +15.7%, Menlo Park +10.0%, Los Altos +8.0%, Los Altos Hills +6.2%, Palo Alto +5.6%, San Francisco metro +2.4%, San Jose metro +0.8%
Change in Zillow's typical single-family home value, August 2025 to August 2026. Zillow Home Value Index: single-family homes, middle tier, smoothed and seasonally adjusted; the same series for the five communities and both metro areas. Source: Zillow Research, data downloaded October 7, 2026.

That makes Palo Alto the slowest-growing of these five communities on this particular measure. It does not tell us that your home is worth less than it was, or that buyers have stopped competing here.

What buyers actually paid

My analysis covers 299 Palo Alto single-family homes that went into contract in 2026 and had closed by September 25. It’s a partial year, and it counts closed sales only:

  • $2,166 per square foot: the median for homes in the sample. Each of this year’s three quarters set a new quarterly high in records going back to 1998.
  • 70% sold above their original asking price — 205 of the 291 sales that have an original list price recorded.
  • 8 days: the median days on market, as the MLS records it.

Those are signs of competition within this sales sample. They are not a promise that every home will sell quickly or above asking. Asking prices are also part of a seller’s strategy; selling above asking does not, by itself, establish a premium over market value.

For a homeowner, the important question is which of those sales are genuinely comparable, and what made buyers respond to them.

Wondering which sales are relevant to your home? Send me your address. I’ll help you identify the useful comparisons and discuss what they suggest for your sale.

Why both numbers can be true

Zillow’s index and the sales figures answer different questions. One tracks estimated whole-home values across a broader housing stock. The other describes the price per square foot of the homes that sold. They also cover different time periods.

The sales median can change because the homes being sold change. Smaller houses, newer construction, renovations, lot characteristics, and neighborhood differences can all affect the result. A rise in the median does not mean every Palo Alto home gained the same amount.
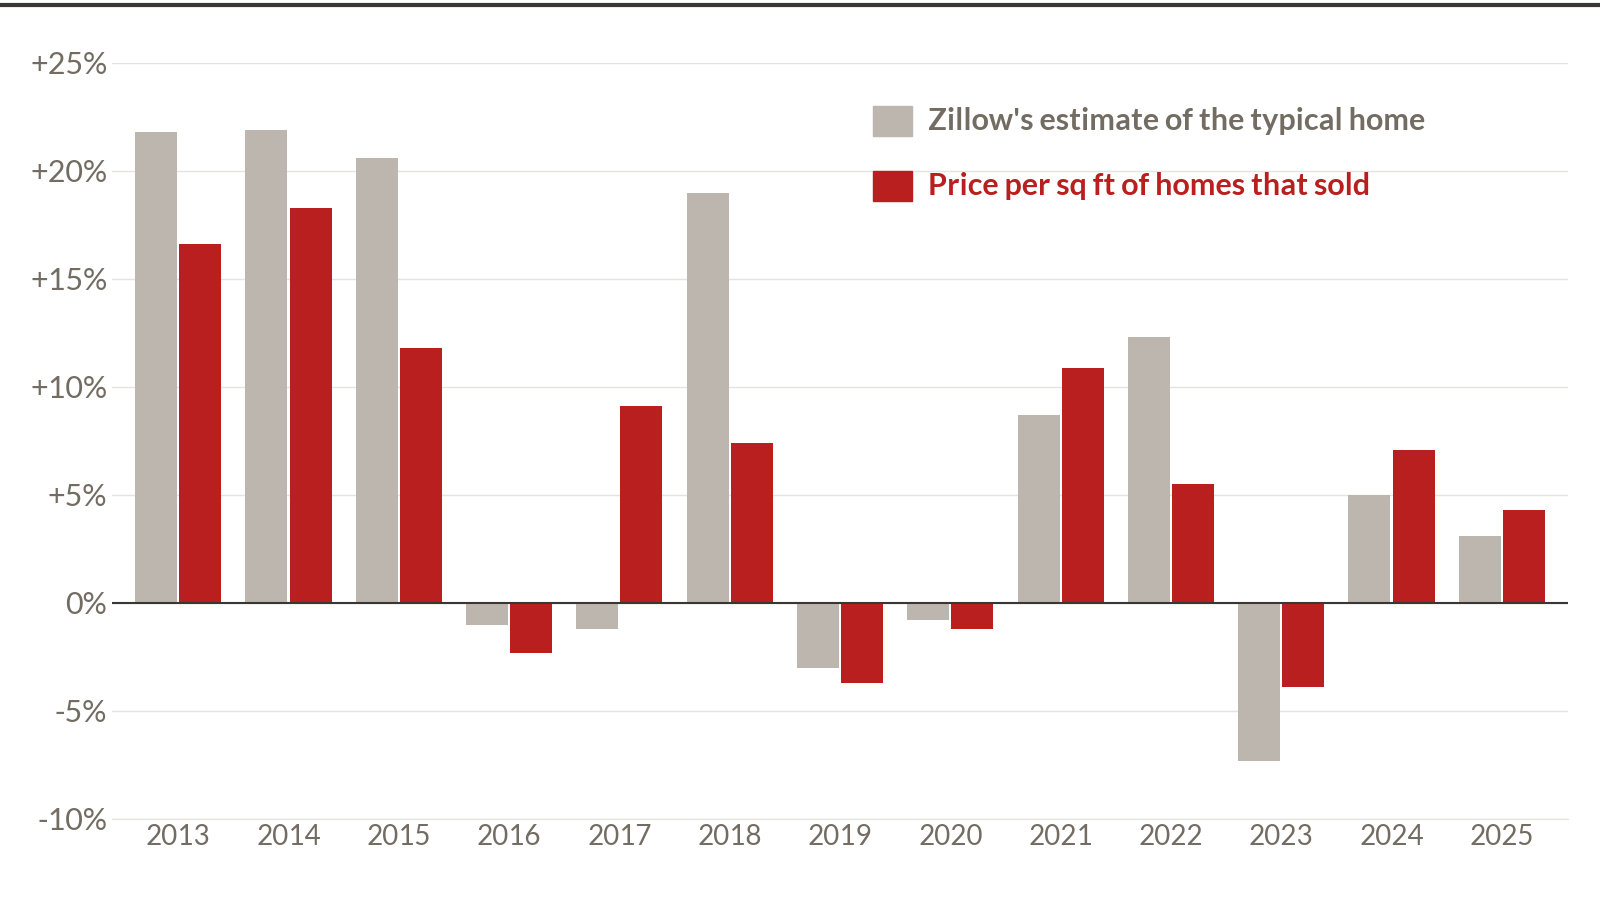
Palo Alto, yearly change 2013 to 2025, full calendar years: Zillow's typical home value in grey and the median price per square foot of homes that sold in red. In some years Zillow's measure rose faster, in others the sales did
Palo Alto, change from the previous full calendar year, 2013–2025. Grey: Zillow's typical single-family home value, calendar-year average of the monthly index. Red: median price per square foot of closed single-family sales, by contract year. 2026 is left out because neither series covers a full year yet. The chart compares growth rates, not prices. Sources: Zillow Research; MLS data compiled by Maggie Ma.

The comparison is useful context. It cannot isolate how much of the difference came from preparation, location, the mix of homes sold, or other factors.

Where local judgment matters

I tour homes across Palo Alto, Menlo Park, and Atherton every week. I’m looking at what buyers will compare: the layout, light, condition, street, outdoor space, and how the home feels in person.

A nearby sale may look like a perfect comparison on a screen and feel quite different when you walk through the door. A renovated home may help show what buyers will pay for convenience, but it doesn’t automatically tell us what a home needing work should list for.

That’s where I begin with a seller: the right comparable sales, an honest assessment of the home, and a plan for what is worth changing.

Sometimes that means targeted improvements. Sometimes it means leaving a perfectly serviceable kitchen alone and focusing on light, paint, landscaping, or presentation. Sometimes selling as-is is the better fit for the owner’s circumstances.

My role is to help make those decisions, and personally guide the preparation we agree on. Through G.Studio, my staging company, I also shape the home’s presentation with customized staging included in my listing service. How that worked on one Palo Alto house.

The goal is to spend thoughtfully and give buyers clear reasons to choose your home.

Before you spend money preparing to sell

Start with three questions:

  • What would buyers compare my home with today? Look beyond proximity and square footage to condition, layout, lot, and location.
  • Which improvements are worth considering, and which can we skip? A larger renovation budget is not automatically a better selling strategy.
  • How should price and presentation work together? The asking price needs to make sense alongside the alternatives buyers can actually purchase.

You don’t need to finish the projects before calling me. The earlier conversation is often the useful one.

Let’s look at your home, not just the headline

If selling is on your mind, call or text me with your address and the timing you’re considering. We can review relevant sales, discuss a realistic price range, and identify what I would, and wouldn’t, do before listing.

Whether you’re planning for this season or a year or two ahead, you can start with a conversation.

Discuss my home's price and preparation

Prefer to text? Text Maggie at 650.709.5588. English and Mandarin.

Sources

  1. Zillow Research housing data: Zillow Home Value Index (ZHVI), single-family homes, middle tier, smoothed and seasonally adjusted, by city and metro. August 2025 to August 2026, downloaded October 7, 2026
  2. Zillow ZHVI methodology
  3. MLS records for Palo Alto single-family homes sold, contract dates 1998 through September 25, 2026, compiled by Maggie Ma
  4. The companion piece: "Nearly 4 in 10 Palo Alto buyers paid cash this year", Above Asking, October 7, 2026

Maggie Ma Keller Williams Palo Alto · DRE #02117367 Published

How I did this. The Zillow figures are the Zillow Home Value Index for single-family homes, middle tier (35th–65th percentile), smoothed and seasonally adjusted — the same series for all five communities and both metro areas, August 2025 to August 2026, which is the latest month Zillow publishes for cities. It describes estimated values across a community's housing stock, including homes that did not sell, and it is not the individual Zestimate shown on a property page. The sales figures are MLS records for Palo Alto single-family homes with status Sold, grouped by contract date: 299 homes that went into contract in 2026 and had closed by September 25. Homes that went into contract in 2026 but had not closed by then are not included, so no pending prices are implied. Price per square foot is each sale's price divided by its recorded living area, for homes of 400 to 20,000 square feet, then the median. The above-asking share compares the sale price with the original list price, over the 291 sales that have one recorded. Figures are as published and are not revised.

Palo Alto · Market note

Nearly 4 in 10 Palo Alto buyers paid cash this year. How much do mortgage rates still matter here?

38% of Palo Alto buyers paid all cash in 2026, the highest share since 2016. The other 62% borrow — and in 2022 a fast rate jump cut over-asking sales from 74% to 32% in a single year.

Paid all cash, 2026 so far
38%
114 of 299 sales. The highest share since 2016, when it was 41%
Paid all cash in 2021
21%
The low point of the last decade, when the 30-year rate was under 3%
Sold over asking, early 2022
74%
By the last quarter of that year it was 32%, as the 30-year rate went from 3.8% to 6.7%
On this year's median sale
$23,500
Monthly principal and interest on a $3.3M loan at 7.66%, the jumbo average this week. Every quarter point adds about $560

Nearly four in ten Palo Alto home purchases this year were completed entirely in cash.

In a market where homes routinely cost several million dollars, that is a striking concentration of purchasing power. Of the 299 single-family sales that went into contract in 2026 and closed by September 25, 114 were recorded as all cash — the highest share since 2016.

For homeowners, this helps explain why mortgage-rate headlines alone cannot tell the whole story of demand in Palo Alto.

It’s the question I get whenever rates are in the news: doesn’t everyone in Palo Alto pay cash anyway? Not everyone. But more than most people think, and more than at almost any point in the last decade.

Rates still matter. But how much they matter to your sale depends partly on who is likely to buy your home — and what will persuade those buyers to compete for it.

How many buyers paid cash

Of the 299 Palo Alto homes that went into contract this year and closed by September 25, 38% were bought with all cash. That’s the highest share since 2016.

Share of Palo Alto single-family sales bought with all cash, by year, 1998 to 2026: 8% in 1998, 7% in 2004, a peak of 43% in 2015, 21% in 2021, and 38% in 2026
Share of Palo Alto single-family sales bought with all cash, by contract year. 2026 through September 25 (299 sales). MLS data compiled by Maggie Ma; Buyer's Financing recorded as All Cash.

The long view is a surprise. In the mid-2000s, fewer than 1 in 10 buyers paid cash. The share climbed through the 2010s and peaked at 43% in 2015. It fell to 21% in 2021, when rates were under 3%, and has climbed every year since but one.

So here’s a fair question: do rates drive the cash share? Over 28 years, not in any steady way — cash rose right through the 2010s while rates were low and falling. The last five years have moved together, which is five annual points against twenty that went the other way. Worth noticing, not enough to call a pattern. What I can say plainly is the narrower thing: when borrowing got expensive, a larger share of the buyers who won homes here were the ones who didn’t need to borrow.

The other 6 in 10

The flip side matters just as much. The other 62% of this year’s buyers didn’t pay all cash, which in Palo Alto mostly means a jumbo mortgage. For them, rates aren’t abstract.

On this year’s median Palo Alto sale of $4.14 million, a 20% down payment leaves a loan of about $3.3 million. At this week’s 7.66% jumbo average, principal and interest come to roughly $23,500 a month. Every quarter point adds about $560 to that, or close to $6,800 a year.

For most of those buyers, that kind of math doesn’t decide whether they buy in Palo Alto. It does shape how far they’ll stretch on a particular house, and how many of them show up for it. That second part is the one I watch most closely, because the price a Palo Alto home finally sells for is usually set by the second and third most motivated buyer in the room, not the first.

What rates did to Palo Alto prices last time

The closest thing to a recent test is 2022, and it isn’t a clean one.

Top: the 30-year mortgage rate by quarter, 2021 to 2026, rising from under 3% to about 6.7% during 2022. Bottom: the share of Palo Alto homes sold over asking, falling from 74% in early 2022 to 32% at the end of 2022, then recovering to 76% in the third quarter of 2026
Top: Freddie Mac 30-year fixed rate, quarterly average. Bottom: share of Palo Alto single-family homes that sold above the original list price, by contract quarter, over the sales that have an original list price recorded (Q3 2026 through September 25). Two panels rather than one dual axis, because a shared axis would imply a scale the two series do not share. Sources: Freddie Mac PMMS via FRED; MLS data compiled by Maggie Ma.

During 2022, the average 30-year rate went from about 3.8% to 6.7% in three quarters. Palo Alto felt it. The share of homes selling over asking fell from 74% in the first quarter to 32% in the fourth, and the median price per square foot slid about 16% from spring to year end.

Then something interesting happened. Rates stayed high, between about 6% and 7.3% for three years, and the market came back anyway. In the third quarter of this year, before rates passed 7%, 76% of Palo Alto homes sold over asking.

Two cautions belong right next to that. Tech stocks also fell hard in 2022, so the rate jump wasn’t working alone, and nothing in this data separates the two. And one cycle is a story, not a rule — which is why I read 2022 as evidence that Palo Alto responds to a shift in buyers’ finances, and not as a measure of what any particular rate move is worth.

What the cash share doesn’t tell you

The MLS records how a buyer paid, not where the money came from. Stock, the sale of another home and family help all look the same in this column. An all-cash buyer can also take out a loan after closing. So 38% is a real number about a real thing — and it is not a measure of who can afford your house.

How I read an offer when “cash” is on the top line

“Cash” is the word a seller’s eye goes to first, and on its own it settles less than people expect.

When I sit down with a seller and more than one offer in front of us, the price is where we start, not where we finish. I’m reading the deposit, and what its size says about how committed this buyer actually is. Whether the appraisal and loan contingencies are removed, shortened, or still fully in place — and if they’re in place, where that leaves you if the buyer walks. How solid the proof of funds really is, because a screenshot of a brokerage account and a verified bank balance are not the same document. The closing date, measured against your own next move rather than against the calendar. Whether a rent-back is offered, needed, or quietly assumed. And who the buyer’s lender is, because at Palo Alto loan sizes some lenders close in three weeks and some do not.

A financed offer with real money down, short contingencies and a close that fits your plans can be a better outcome for you than a higher all-cash offer that wants sixty days and a full inspection window. When I think that’s the case I’ll say so, and I’ll show you what I’m weighing rather than just handing you a recommendation. The decision is yours. My job is to make sure it’s an informed one rather than a hopeful one.

Before you spend money on the house

This is where I can save an owner the most, and it’s the decision owners most often make alone — almost always in the direction of doing more than the house needs.

When I walk through a home I’m not making a wish list. I’m looking at a narrower set of things: which two or three rooms a buyer will actually decide in, and what the eye lands on in the first few seconds of each; how the floor plan reads on the way through, and whether anything interrupts that walk; where the light comes from and at what hour; what the outdoor space could become with very little done to it; how the street and the approach set expectations before anyone is through the door; and what else is likely to be on the market the same weeks yours is, because buyers judge your house alongside those, not on its own.

Out of all of that, only a handful of things usually change what a buyer will pay. The rest is money you don’t have to spend. Which handful it is depends entirely on the house, which is why I won’t guess at it from the outside — and why this conversation is worth having before the contractor, not after.

What this means if you’re thinking about selling

If a move is already on your horizon, here’s how I’d think about this fall:

  1. Talk to someone before you spend anything. Preparation is the part of a sale that is hardest to undo and easiest to overpay for. An hour walking the house together, before any money is committed, is the cheapest hour in the whole process and usually the one that moves the final number most.
  2. Plan for both buyers. With roughly 4 in 10 paying cash and 6 in 10 borrowing, a home here usually needs to work for both. Which of them your house is most likely to attract shapes how I’d prepare it, price it and launch it — and that’s a judgment about your house, not about the market.
  3. Expect financed buyers to be careful this month. A quarter point is real money at Palo Alto loan sizes. That’s a reason to get the presentation and the price right from day one, and a weaker reason to wait.
  4. Don’t build a plan on guessing rates. This year alone, Freddie Mac’s average has been as low as 5.98% (in February) and as high as 7.28%. Your house, your timing and your next move are better places to start.

Rates matter in Palo Alto, just less evenly than the headlines suggest. Which buyers your home attracts, how far a rate move actually reaches them, and what is genuinely worth doing to the house before it goes out are all questions about your house rather than about the market.

If a sale is anywhere on your horizon, come and talk to me before you spend money on improvements. I’ll walk the house with you and tell you honestly what I think it needs and - just as importantly — what it doesn’t. You’re free to do whatever you like with that. No commitment, and nothing to sign. In English or 中文.

Talk through your home’s numbers

Prefer to text? Text Maggie at 650.709.5588.

Sources

  1. Freddie Mac, Primary Mortgage Market Survey, 30-year fixed, weekly through October 1, 2026, via FRED
  2. Fortune (Mortgage Research Center data), "Mortgage rates today, Oct. 7, 2026: Rates remain elevated," October 7, 2026
  3. MLS records for Palo Alto single-family homes sold, contract dates 1998 through September 25, 2026 (13,371 sales), compiled by Maggie Ma
  4. The companion piece: "Zillow's numbers and Palo Alto sales tell different stories", Above Asking, October 7, 2026
  5. On the 2022 tech year: "How closely do Palo Alto home prices follow tech stocks?", Above Asking, September 28, 2026

Maggie Ma Keller Williams Palo Alto · DRE #02117367 Published

How I did this. The Palo Alto figures are MLS records for single-family homes with status Sold, grouped by contract date, 1998 through September 25, 2026 — 13,371 sales, of which 299 went into contract in 2026 and had closed by September 25. The cash share counts sales whose Buyer's Financing is recorded as All Cash; the MLS records how a buyer paid, never where the money came from. The over-asking share compares the sale price with the original list price, over the sales that have one recorded. Rates are the Freddie Mac Primary Mortgage Market Survey 30-year fixed, weekly, averaged by quarter. The payment figures are principal and interest only, 30-year fixed, 20% down on this year's median Palo Alto sale price of $4,137,000. Figures are as published and are not revised.
Palo Alto · Market note

Higher Mortgage Rates: Should Palo Alto Sellers Change Their Plans?

The September Fed minutes, released October 7, leave another increase open before year end and commit to nothing. On an illustrative Palo Alto loan, moving from 6.5% to 7.5% adds about $2,222 a month — enough to change what a buyer will pay, and not enough on its own to decide whether you list.

Fed target range
3.75%–4%
Raised a quarter point at the September 15–16 meeting. The minutes leave another increase open this year and commit to nothing
Monthly payment at 6.50%
$20,919
Principal and interest on a $3,309,600 loan, 30-year fixed
The same loan at 7.50%
$23,141
One percentage point higher, on the same principal and term
The difference
$2,222 a month
About $26,700 a year. Hypothetical scenarios, not loan offers, and before property taxes, insurance and other ownership costs

Another Fed headline. Another reason to wonder whether this is still a good time to sell.

The September meeting minutes, released October 7, show that most Fed participants considered another rate increase likely to be appropriate before year-end. Meanwhile, higher borrowing costs are giving buyers more to think about.

For Palo Alto homeowners, the useful question is how that changes the buyers, competition, and timing for your particular home.

My approach: review those conditions before changing your plans. A Fed headline alone isn’t enough to decide whether to list or wait.

What the Fed said, and what it means for mortgages

At its September meeting, the Fed raised its target range by a quarter percentage point, to 3.75%–4%. The minutes leave room for another increase this year, while making clear that future decisions depend on incoming information. They do not commit the Fed to a December increase.1

The Fed’s policy rate influences borrowing conditions, but it does not directly set the rate on a 30-year mortgage. Fixed mortgage rates often move with longer-term bond yields, including the 10-year Treasury; the gap between them also changes. The actual quote also depends on the loan terms, the lender’s pricing and the borrower.2

The 10-year Treasury measure published through FRED was 5.31% on October 5 and 5.27% on October 6. Those are dated observations, not a live mortgage quote.3

The practical point for sellers: buyers’ financing can change before the next Fed meeting. Waiting for an announcement does not guarantee a better selling window.

A small rate change can mean a meaningful budget change

Consider an illustrative $4.137 million purchase with 20% down: a loan of $3,309,600. On a fully amortizing, 30-year fixed-rate loan:

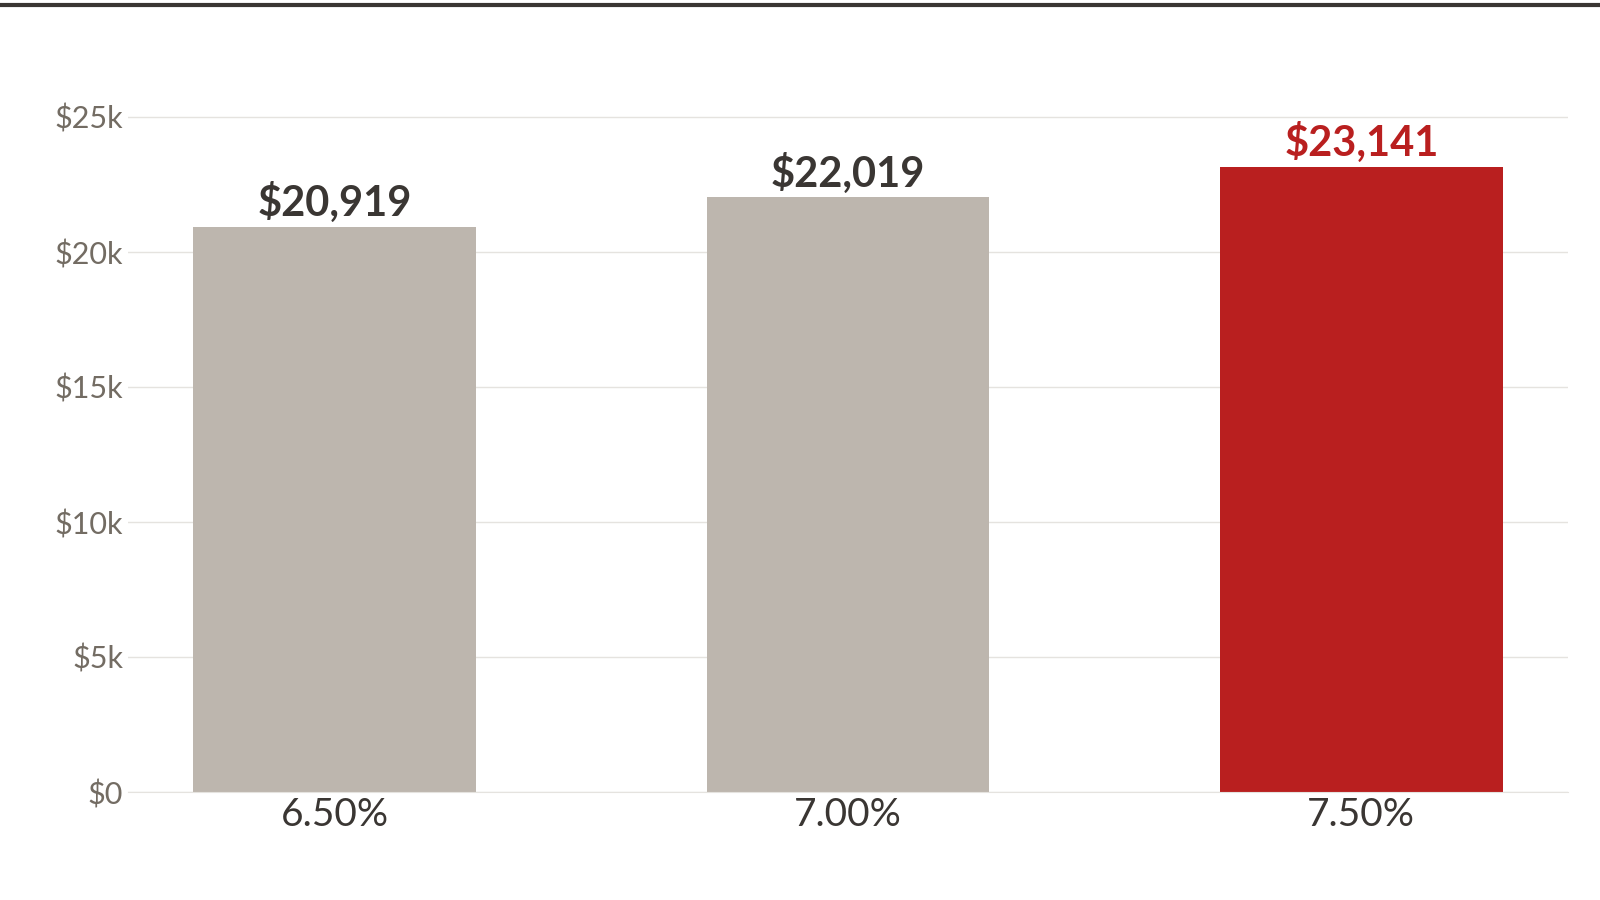
Monthly principal and interest on a $3,309,600, 30-year fixed loan: $20,919 at 6.50%, $22,019 at 7.00%, $23,141 at 7.50%
Illustrative monthly principal and interest on a $3,309,600, 30-year fixed-rate loan (20% down on $4,137,000). Not loan offers. Excludes property taxes, insurance and other ownership costs. Calculation by Maggie Ma.
Interest rateMonthly principal and interest
6.50%$20,919
7.00%$22,019
7.50%$23,141

Moving from 6.5% to 7.5% adds about $2,222 a month, or approximately $26,700 a year, for the same loan amount.

These are hypothetical scenarios, not available loan offers. They exclude property taxes, insurance, and other ownership costs.4

A buyer may respond by increasing the down payment, reducing the purchase budget, considering different financing, or waiting. I can’t assume which choice they will make. But sellers should recognize that the same house can represent a different financial commitment as rates change.

Palo Alto has cash buyers. That doesn’t make it immune.

In my analysis of 299 Palo Alto single-family sales that went into contract in 2026 and closed by September 25, 38% were recorded as all-cash purchases.5

That is useful context. It does not mean rates are irrelevant to the remaining buyers, or that cash buyers will pay any price. They still compare alternatives and decide what a home is worth to them.

The timing of the data matters, too. Sales closed by September 25 cannot tell us how buyers will respond to October’s financing conditions.

If your home is coming to market now, I would look closely at its current competition, recent comparable sales, and what fresh showings and offers tell me.

What I would review before you list

The homes your buyers can choose instead.

Last spring’s sale may be useful background, but buyers are choosing among today’s options. I would compare your home’s condition, layout, location, and asking price with the relevant alternatives, then consider what recent sales tell us.

The preparation that deserves your time and money.

This is a good moment to be selective. I help sellers decide what to improve, what to leave alone, and how to present the home clearly. A larger renovation budget is not automatically a better strategy; sometimes focused work is the right fit.

The plan for the first weeks on the market.

I want the price, photography, presentation, and outreach to work together from the start. Then I watch the response: inquiries, showings, feedback, and offers. If interest falls short, I’ll look at why and recommend what to change, and you decide.

The cost of waiting in your own life.

Your move, carrying costs, preparation schedule, and flexibility matter alongside market conditions. Waiting may make sense for one owner and create unnecessary expense or disruption for another.

Should you sell now or wait?

I would want to understand your home and your plans before recommending either.

If selling is on your mind, send me your address and approximate timing. Together we can review the competition, discuss a realistic pricing approach, and identify what I would, and wouldn’t, do before listing.

You do not need a finished renovation or a firm moving date to start that conversation.

Discuss my home’s price and timing

Or call or text Maggie: 650.709.5588. English and Mandarin.

Sources

  1. Federal Reserve, minutes of the September 15–16, 2026 meeting, released October 7. Minutes describe the discussion at that meeting, rather than a new policy decision on their release date
  2. Freddie Mac, research on mortgage rates and Treasury yields. Mortgage rates and the 10-year Treasury are related but do not move in lockstep
  3. Federal Reserve H.15 via FRED, DGS10, October 5–6, 2026 observations, retrieved October 7. This is a constant-maturity yield measure
  4. Payment calculations: $3,309,600 principal, 360 monthly payments, nominal annual interest rate divided by 12. Rounded to the nearest dollar. The example uses the $4,137,000 median purchase price from Maggie Ma's MLS analysis; it does not describe a particular transaction or an average buyer's down payment
  5. Maggie Ma's MLS analysis: Palo Alto single-family homes contracted in 2026 and closed by September 25; 299 sales. Cash share is based on recorded financing information
  6. The companion pieces: "Zillow's numbers and Palo Alto sales tell different stories" and "Nearly 4 in 10 Palo Alto buyers paid cash this year", Above Asking, October 7, 2026

Maggie Ma Keller Williams Palo Alto · DRE #02117367 Published

How I did this. The Fed figures are the minutes of the September 15–16, 2026 FOMC meeting, released October 7. The Treasury figures are the 10-year constant-maturity yield published through FRED, observations of October 5 and 6, 2026, retrieved October 7. The payment figures are principal and interest only on a $3,309,600 loan — 20% down on $4,137,000, the median Palo Alto sale price in my 2026 analysis — over 360 monthly payments, at a nominal annual rate divided by 12, rounded to the nearest dollar. The cash share counts sales whose Buyer's Financing is recorded as All Cash, among 299 Palo Alto single-family homes that went into contract in 2026 and had closed by September 25. Figures are as published and are not revised.