Above Asking · Week of September 28, 2026 · print edition Letter, 2 pieces · use your browser’s Save as PDF

Back to the issue HOUSE EXPERT

Above Asking

Market intel · weekly

Silicon Valley · Market note

When tech stocks rise, what happens to Silicon Valley home prices next?

A 35-year look at Nasdaq returns against the Santa Clara and San Mateo county home-price indexes finds a real relationship — but housing moved more slowly, and by far less, than the stock market.

The year after the Nasdaq fell
+1.6%
Average change in the Santa Clara and San Mateo county index, across the 8 down years in 1991–2024
The year after an ordinary up year
+6.1%
16 years. Direction is what separates this from the row above
The year after it rose 30% or more
+6.2%
10 years. Four times the stock return, and the same housing year
Nasdaq, end 2022 to end 2025
+122%
Against +11% in Santa Clara County and +7% in San Mateo (FHFA), and +6% for the San Francisco metro (Case-Shiller) — three different measures

Something happens — but less of it, later, and not in proportion to the stock chart. The most interesting thing in 35 years of numbers is not how much housing moved. It is that whether the Nasdaq had a good year mattered a great deal, and how good that year was barely mattered at all.

A note on scope before anything else, because it changes how you should read every figure below. This article uses county data: the federal home price index for Santa Clara and San Mateo counties. That is Daly City and Gilroy as well as Atherton and Palo Alto. It is the right lens for a regional question and the wrong one for a particular town, which is why the companion piece runs the same question again on 13,371 Palo Alto sales — and gets a visibly different answer.

The running joke

Around here, people like to joke that Peninsula home prices never go down. It’s one reason I named this publication Above Asking.

But if you own a home on the Peninsula, you also have a front-row seat to the stock market. Many local owners and buyers work in tech, and plenty of them are paid partly in stock. When the Nasdaq has a great year, open houses seem to get busier. When it has a terrible one, dinner-party conversation gets a little quieter.

So is that feeling real? Do Silicon Valley stock prices actually move our home prices? I went through 35 years of numbers and three decades of research to find out.

What the economists found first

I’m not the first person to wonder. In September 2000, just as the dot-com bubble was bursting, two economists at the Federal Reserve Bank of San Francisco, John Krainer and Fred Furlong, looked at quarterly data from January 1992 to June 2000 and found that changes in the value of local high-tech companies helped forecast what Bay Area house prices did next. Their estimate: a 10% rise in local high-tech market valuation went with roughly a 1% to 2% rise in house prices over two years. The stocks moved first, the homes followed, and the housing move was much the smaller of the two. They found no such link in Los Angeles or San Diego.

IPOs are the most direct way stock turns into a down payment, so researchers have studied those too. A UCLA study of 720 California IPOs from 1993 to 2017 found that home prices near the company rose an average of 3.3% within one mile between the day it filed to go public and its first day of trading. Within five miles the rise was 1.7%, and within ten miles 1.3%.

How much home prices rose near a company between its IPO filing and its first day of trading, by distance. Study of 720 California IPOs, 1993–2017 (Hartman-Glaser, Thibodeau and Yoshida), as reported by UCLA Anderson Review, 17 April 2019.

In other words, buyers started house-hunting before they could sell a single share. Apparently not everyone waits for the lockup.

A second study, of IPOs across the country from 1998 to 2015, found that home prices near the company got another lift after the lockup ended, when employees could finally sell. Prices climbed even more when the new stock jumped after its debut.

What 35 years of data show

Then I ran my own check. I lined up the Nasdaq’s year-end close from 1990 through 2025 against the federal home price index for Santa Clara and San Mateo counties. Those two counties hold all six towns I watch most closely: Palo Alto, Los Altos and Los Altos Hills on one side of the county line, and Atherton, Menlo Park and Hillsborough on the other. They also hold a great many places unlike any of those, which is the limitation of a county average and the reason for the second article.

The Nasdaq’s year-end close against the FHFA All-Transactions index for Santa Clara County, 1990–2025, both indexed so that 1990 = 100, on a log scale. A stock index and a house-price index share an axis only when they are indexed and logged: the shapes are comparable, the levels are not.

Three things stood out.

The relationship showed up more clearly in the following year’s housing data. Not in the same calendar year. Over two years, every 10% the Nasdaq gained went with about 2% more home price growth in Santa Clara County — the same broad shape the San Francisco Fed found a quarter of a century ago, and the same order of magnitude, though their study used different data over a different period and I would not claim the two results are the same finding.

I want to be careful with the word lag, because it invites a sentence I am not willing to write. This is not “stocks rise now, so houses rise next year.” It is an observational pattern in two series that keep time differently — a year-end stock close against an annual average of home sales — and the honest version is simply that the housing response was more visible in the following year than in the same one.

Even the dot-com crash took a while to arrive. The Nasdaq lost 39% in 2000, and county home prices still rose about 11% in 2001, averaged over the year. Santa Clara County then slowed to 0.6% in 2002.

The link is real, but loose. Stocks explain some of the swings in local home prices, not most of them. Mortgage rates, jobs and plain old supply matter too. 2008 is the clearest case: that crash started with mortgages, not tech, and home prices fell anyway.

Direction mattered. Size barely did. The Nasdaq fell in 8 of the past 35 years. In the year after those 8, county home prices rose an average of 1.6%. After the up years, they rose about 6%. That gap — roughly four and a half points — is the real finding, and it is a large one.

What is not there is any extra reward for an extraordinary rally.

Average change in the Santa Clara and San Mateo county home-price index the year after, grouped by what the Nasdaq did that year. Nasdaq years 1991–2024, housing 1992–2025. A year-end stock close against an annual average of home sales — two timing conventions, set side by side for context. Past patterns are not a forecast.

Here’s the part that made me laugh. After a year the Nasdaq rose 30% or more, county home prices rose 6.2% the next year. After an ordinary up year, 6.1%. Four or five times the stock return produced one tenth of a point more housing.

So a positive year for tech does appear to matter, and it matters quite a lot. The size of that year is where the relationship stops paying. Tech wealth, in this data, behaves like a tailwind rather than a timetable: it helps, it does not arrive on schedule, and twice the wind does not get you there twice as fast.

The twist since 2022

From the end of 2022 to the end of 2025, the Nasdaq more than doubled. It rose 122%. Housing rose, but nothing like that: the FHFA county index was up 11% in Santa Clara and 7% in San Mateo, and the Case-Shiller index for the San Francisco metro area — a different kind of series, covering a different footprint — rose 6%.

That is three separate measures, and they are worth keeping separate. Two are county repeat-sales indexes; one is a metro index. None of them is a Palo Alto number.

Change from the end of 2022 to the end of 2025. Three kinds of measure: a stock index, two FHFA county repeat-sales indexes and one Case-Shiller metro index. Context, not a like-for-like comparison.

It would be easy to read that gap as proof that tech wealth stopped mattering. I don’t think it shows that at all. It shows that stock wealth does not convert dollar for dollar into house prices, which it never has — and that a great many other things were moving at the same time: borrowing costs, affordability, how much was for sale, who was hiring, and what kind of homes happened to change hands.

Mortgage rates are the counterweight I would bet on, and I want to be clear that betting is what it is. Nothing in this data isolates rates from everything else that was happening.

But county averages hide a lot. They mix a Palo Alto Craftsman with a Sunnyvale condo. The top of the market tells a different story. The Almanac reported that home prices rose 8% in Palo Alto, 9% in Menlo Park and 17% in Atherton in the first eight months of this year. Redfin counted four of the country’s ten most expensive August home sales in the Bay Area, and said the big month “comes as AI wealth drives the region’s housing market.”

So here’s what I think is happening, and I want to be clear that it is a hunch: stock wealth now shows up most in a handful of towns at the very top, while the county averages stay calm. The companion piece is the first test of that hunch, and it comes out in favour of it.
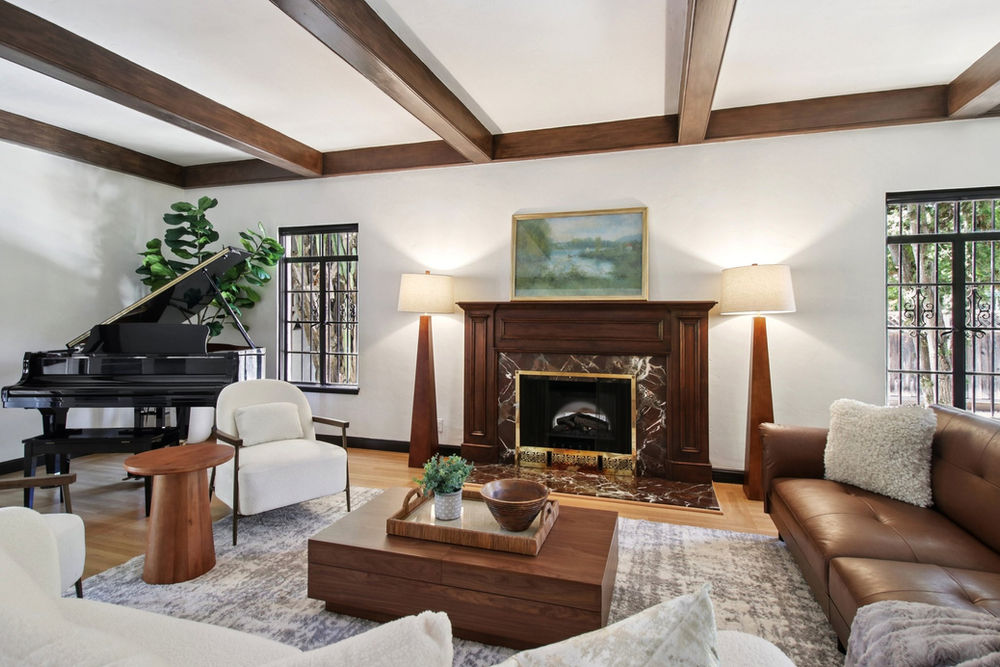
The living room at 1560 University Avenue, Palo Alto
1560 University Avenue, one of my Palo Alto listings. A county average can't tell you much about a house like this, which is why the second article goes town by town.

The broad view, and the narrow one

County data is the broad view. It is honest about the region and silent about your street. So I also ran the same question using 13,371 Palo Alto single-family sales — every one in the MLS since 1998 — and the answer changes shape: How closely do Palo Alto home prices follow tech stocks?

The short version, if you only read one line of it: where the county barely distinguishes a spectacular tech year from an ordinary one, Palo Alto distinguishes them sharply, and it is the only one of the two that has actually gone down after a bad year for tech. Atherton, Menlo Park, Los Altos, Los Altos Hills and Hillsborough come after that, once I’ve pulled their records too.

What this means if you’re selling

None of this is a market-timing rule, and I would be uneasy if it were read as one.

A strong Nasdaq is useful context. It is not by itself a reason to sell, and it is not a reason to wait either. If a move is already somewhere on your horizon, the questions that actually decide how it goes are the ones you can answer today: what buyers are doing right now, how much competing inventory is on the market, where rates sit, and how your particular home — its condition, its price band, its presentation — fits what is in front of it.

Waiting for a hoped-for stock-market effect means trading a market you can evaluate today for one you cannot.

A few things that are worth holding on to:

  1. Read the Nasdaq by the year, not by the morning. A rough week won’t change who shows up at your open house on Sunday.
  2. After a down year for tech, price for a calmer county market. Historically the following year was flat to slightly up out here, with buyers still present and fewer of them bidding against each other. Palo Alto itself has behaved differently, and the companion article has that number.
  3. Watch IPO filings rather than lockups. Buyers tend to start shopping when a company files to go public, not when they can finally sell. Worth knowing. Not worth rushing for.
  4. Expensive borrowing can drown out a great stock market. Since 2022 a doubling Nasdaq moved the county averages very little. That is a reason to look at rates and inventory alongside the stock chart, not instead of your own situation.

The bottom line

Tech stocks do move Silicon Valley home prices. They do it slowly, more visibly in the following year than the same one, and by a small fraction of the stock market’s swing — and the direction of the tech year matters far more than its size.

So the Nasdaq is worth watching if you own a home here. It tells me something about the environment. It cannot tell me when your house should go on the market.

That part takes looking at your house, your street and this month’s competition. I’m glad to do that with you, in English or 中文. No pressure, and no stock tips.

Ask me what today's market means for your home.

Talk through your home’s numbers

Prefer to text? Text Maggie at 650.709.5588.

Sources

  1. John Krainer and Fred Furlong, "Tech Stocks and House Prices in California", Federal Reserve Bank of San Francisco Economic Letter, September 15, 2000
  2. UCLA Anderson Review, "How Will You Spend Your IPO Windfall?", April 17, 2019
  3. Barney Hartman-Glaser, Mark Thibodeau and Jiro Yoshida, "Cash to Spend: IPO Wealth and House Prices", Real Estate Economics, 2023
  4. Rice Business Wisdom, "How Does an IPO Affect Your Community?"
  5. Alexander W. Butler, Larry Fauver and Ioannis Spyridopoulos, "Local Economic Spillover Effects of Stock Market Listings", Journal of Financial and Quantitative Analysis, 2019
  6. Nasdaq Composite year-end closes: Wikipedia, "Nasdaq Composite", cross-checked against 1stock1.com
  7. Federal Housing Finance Agency, All-Transactions House Price Index for Santa Clara County, annual, via FRED
  8. Federal Housing Finance Agency, All-Transactions House Price Index for San Mateo County, annual, via FRED
  9. S&P Cotality Case-Shiller San Francisco Home Price Index, seasonally adjusted, via FRED
  10. The Almanac, "$1M over-asking still isn't bringing more homes to market on the Midpeninsula", September 15, 2026
  11. Redfin, "The Bay Area Leads August's Most Expensive Home Sales With a $70M Hillsborough Estate", September 16, 2026

Maggie Ma Keller Williams Palo Alto · DRE #02117367 Published

How I did this: I compared each year's change in the Nasdaq's year-end close with the change in the FHFA home price index for Santa Clara and San Mateo counties the same year, the next year and the year after. The bucket averages pair Nasdaq years 1991–2024 with the housing change in the following year, 1992–2025. The two series keep time differently and I have not pretended otherwise: the Nasdaq figure is a year-end close, while the FHFA index is an annual average of repeat sales across all price ranges. It is a county-wide measure. It is not Palo Alto, which has its own article. Figures are as published and are not revised.

Palo Alto · Market note

How closely do Palo Alto home prices follow tech stocks?

I compared 13,371 Palo Alto single-family sales since 1998 with the Nasdaq. Palo Alto is markedly more responsive to tech wealth than the county data — but not predictably enough to use a stock chart as a selling calendar.

Palo Alto sales examined
13,371
Every single-family sale in the MLS with a contract date from 1998 to this September
The year after the Nasdaq fell
−3.3%
Average change in Palo Alto's median price per square foot. Over the same years the two counties rose 1.6%
The year after it rose 30% or more
+13.8%
Against +7.6% for the two counties. Here the size of the tech year shows up; in the county data it does not
Sold over asking, 2026 so far
70%
The highest share since 2015

Closer than the county data suggests — close enough that the two analyses tell genuinely different stories.

Why I ran the question twice

The regional article uses the federal home price index for Santa Clara and San Mateo counties, going back to 1990. That is the right instrument for a regional question and a blunt one for a particular town: a county index combines very different cities, price ranges and property types, and Palo Alto’s exposure to tech wealth is not the county’s exposure to tech wealth.

In the county numbers, the direction of the tech year mattered and the size of it barely did — a 30%-plus Nasdaq year was followed by 6.2% county growth against 6.1% after an ordinary good year. That result is real, and it is the kind of result a county average is prone to producing, because averaging across a whole county is exactly how you flatten the places that move most.

So I ran the question again on Palo Alto itself. I went to the MLS and pulled every Palo Alto single-family sale in its records: 13,371 sales with a contract date from 1998 to this September.

I dated each sale by the day the buyer and seller agreed on a price, not the day it closed — falling back to the close date in the few cases where the contract date was missing. Closing usually comes about four weeks later, and four weeks matters when you’re lining houses up against the stock market. A handful of records go back to 1994, but the MLS only has the full picture from 1998, so that’s where I start.

For each year I took the median price per square foot of the contracts signed that year, for homes between 400 and 20,000 square feet. Then I paired the Nasdaq’s year-end change for 1999 through 2024 with Palo Alto’s change the following year, 2000 through 2025 — and ran the counties over those same Nasdaq years, so the comparison is fair on timing even though a median of real sales and a repeat-sales index are different animals.

Median sale price per square foot by contract year, Palo Alto single-family homes, 1998–2026 (2026 through September 25 closings). Shaded bands are years the Nasdaq fell. A year's median moves with the mix of homes sold, not only with prices.

Over that stretch, the median price per square foot went from $400 in 1998 to $2,166 so far in 2026. That’s more than five times as much. The Nasdaq did better, about ten times from its 1998 close to its 2025 close. In fairness to your house, you can’t host Thanksgiving in an index fund.

A bad year for tech, then a dip

Each dot is one year: the Nasdaq's change that year, against Palo Alto's price-per-square-foot change the following year, 1999–2026. Red dots are years the Nasdaq fell; black dots are years it rose. The grey line is the trend.

Each dot compares one year of the Nasdaq with Palo Alto’s price change the year after. The pattern is hard to miss. When tech stocks had a good year, Palo Alto prices tended to climb the next year. When they had a bad one, prices tended to slip.

In numbers, every 10% move in the Nasdaq went with roughly a 2% to 3% move in Palo Alto’s price per square foot the following year, depending on whether you count the dot-com years. In the county data it was closer to 1%.

The Nasdaq fell in seven years between 1999 and 2024. In five of the years that followed, Palo Alto’s median price per square foot fell too. On average it dropped 3.3%. The two counties rose 1.6% in those same years.

That is worth sitting with, because it cuts against the running joke. Palo Alto is not immune. It is the more responsive of the two, in both directions.

Different measures: Palo Alto is the median price per square foot of the contracts signed that year; the counties are FHFA's annual repeat-sales index. Same Nasdaq years for both, 1999–2024, paired with the housing change the following year.

And here the size of the tech year shows up, which is the clearest difference between the two analyses. After the seven years the Nasdaq rose 30% or more, Palo Alto’s median price per square foot rose an average of 13.8% the next year. After an ordinary up year it rose 8.0%. The counties, over the same years, managed 7.6% and 6.5% — barely distinguishable from each other.

So in the county data, direction mattered and magnitude didn’t. In Palo Alto, both matter. A town with this much of its buyer pool paid partly in stock does not average away the way a county does.

That is the whole case for reading both articles, and it is also the limit of what either can tell you. A relationship this visible is still not a mechanism:

The stock market is one source of buyer wealth. It is not the Palo Alto housing market.

Two crashes, quarter by quarter

The share of homes selling over asking is my favorite thermometer for this market. It reacts faster than prices do.

Share of Palo Alto homes sold above the original list price, by contract quarter. Some quarters hold as few as about 50 contracts, so read the shape rather than the decimals. 2026 Q3 is partial.
  • The dot-com crash. In early 2000, 83% of Palo Alto homes sold over asking. By late 2001, it was 8%. The median price per square foot fell from $668 in late 2000 to $492 by the third quarter of 2001, a drop of about 26%.
  • 2022. Early that year, 74% sold over asking. By the last quarter, 32%. The median price per square foot went from $1,971 in the spring to $1,658 at year end, down 16%. A year later it was back to $1,856.

Both times, Palo Alto caught a cold within months of tech sneezing. One caution: quarterly numbers jump around, because some quarters have only about 50 contracts. Look at the shape, not the decimals.

Cash is back

Share of purchases where the MLS financing field reads "All Cash No Loans", by contract year. 2026 is through September 25 closings. The MLS does not record where the cash came from.

One more thing jumped out at me. In 1998, 8% of Palo Alto buyers paid all cash. By 2015 it was 43%. When mortgages got cheap, it dropped, to 21% in 2021. So far in 2026, it’s back to 38%.

The MLS can’t tell me where that cash came from. But with the average 30-year mortgage rate above 7%, a buyer who can sell some stock instead of borrowing has a real edge. So does a seller who knows how to weigh a cash offer against a slightly higher one with a loan.

And the last three years?

The Nasdaq rose 43% in 2023, 29% in 2024 and 20% in 2025. Palo Alto’s price per square foot rose 7.1% in 2024, 4.3% in 2025 and 7.7% so far in 2026. Solid, but less than the old pattern would suggest.

Mortgage rates are my best guess, the same one I reached in the regional piece, and it is a guess. Borrowing costs, how much was for sale, who was hiring and what kinds of homes happened to come to market were all moving at once. Nothing here separates them.

Even so, 2026 has been strong. So far this year, 70% of Palo Alto homes have sold over asking — the highest share since 2015.

What this means if you’re selling in Palo Alto

A pattern this visible invites a formula, so let me close the two doors it opens before anything else.

A good tech year is not a reason to postpone a sale. If you are already considering one, I would not hold a well-positioned listing back because the Nasdaq might generate more buyer wealth next year. This year’s competing inventory is knowable. Next year’s is not, and neither is next year’s rate environment, and neither — for that matter — is next year’s Nasdaq.

A bad tech year is not automatically a reason not to sell. The average dip after a down year is 3.3% in a town where the median price per square foot has gone from $400 to $2,166 since 1998, and where every dip so far has been followed by a new high. Three per cent is a number; the right buyer for your particular house, in the season you actually want to move, is a different kind of number. In two of those seven years prices rose anyway.

What the Nasdaq can do is tell you what sort of room you are walking into. What decides the outcome is nearer to hand: available inventory, borrowing costs, buyer confidence, your price segment, the condition and presentation of the house, what else is on the market the week you list, and the house itself.

A few things worth holding on to:

  1. Read the Nasdaq by the year, not the day. A tech year has shown up in Palo Alto prices the following year more often than not. A tech week has shown up in nothing.
  2. After a bad year for tech, price early and carefully. In the years after a Nasdaq drop, 39% of homes sold over asking on average. After up years, about 60%. Buyers get choosier, and an overpriced home sits — which is a pricing instruction, not a waiting instruction.
  3. After a strong year, don’t underprice out of nerves. The following year has usually been a good one here.
  4. Expect cash. More than a third of buyers this year paid all cash. Terms and timing can matter as much as the top number.

The bottom line

So, about that running joke. Do Palo Alto home prices really never go down? Not quite. The median price per square foot dipped in seven of the past 28 years, and most of those dips came the year after a rough one for tech. But so far, every dip has been followed by a new high. The joke gets the details wrong. Over the long run, it still has a point.

Use the Nasdaq as context. Make the selling decision from the housing market in front of you — which is a thing you can actually look at.

Next in this series: Atherton, Menlo Park, Los Altos, Los Altos Hills and Hillsborough, once I’ve pulled their records too. The regional picture, if you have not read it, is in the companion piece.

If you’re wondering what all this means for your home, I’d love to go through the numbers for your street with you. English or 中文, no pressure, and still no stock tips.

Talk through your home’s numbers

Prefer to text? Text Maggie at 650.709.5588.

Sources

  1. MLS data, Palo Alto single-family homes sold, contract dates 1998 through September 2026 (13,371 sales), compiled by Maggie Ma
  2. Nasdaq Composite year-end closes: Wikipedia, "Nasdaq Composite", cross-checked against 1stock1.com
  3. Federal Housing Finance Agency, All-Transactions House Price Index for Santa Clara County, annual, via FRED
  4. Federal Housing Finance Agency, All-Transactions House Price Index for San Mateo County, annual, via FRED
  5. Freddie Mac Primary Mortgage Market Survey, "Mortgage Rates Average 7.03%", via GlobeNewswire, September 24, 2026
  6. The regional companion: "When tech stocks rise, what happens to Silicon Valley home prices next?", Above Asking, September 28, 2026

Maggie Ma Keller Williams Palo Alto · DRE #02117367 Published

How I did this: each sale is dated by its contract (pending) date — the day buyer and seller agreed a price — falling back to the close date where the contract date was missing or out of range. Price per square foot is the sale price divided by the living area, for homes between 400 and 20,000 sq ft. The bucket averages pair the Nasdaq's year-end change for 1999–2024 with the change in Palo Alto's median price per square foot the following year, 2000–2025. The county comparison uses exactly the same Nasdaq years, so the two are like for like in timing even though they are different kinds of measure — a median of actual sales against a repeat-sales index. MLS data, Palo Alto single-family homes sold, contract dates 1998 through September 2026: 13,371 sales, with 2026 running through September 25 closings. Figures are as published and are not revised.